By Jaco Grobbelaar on Wed, Jun 14, 2017 @ 04:03 PM

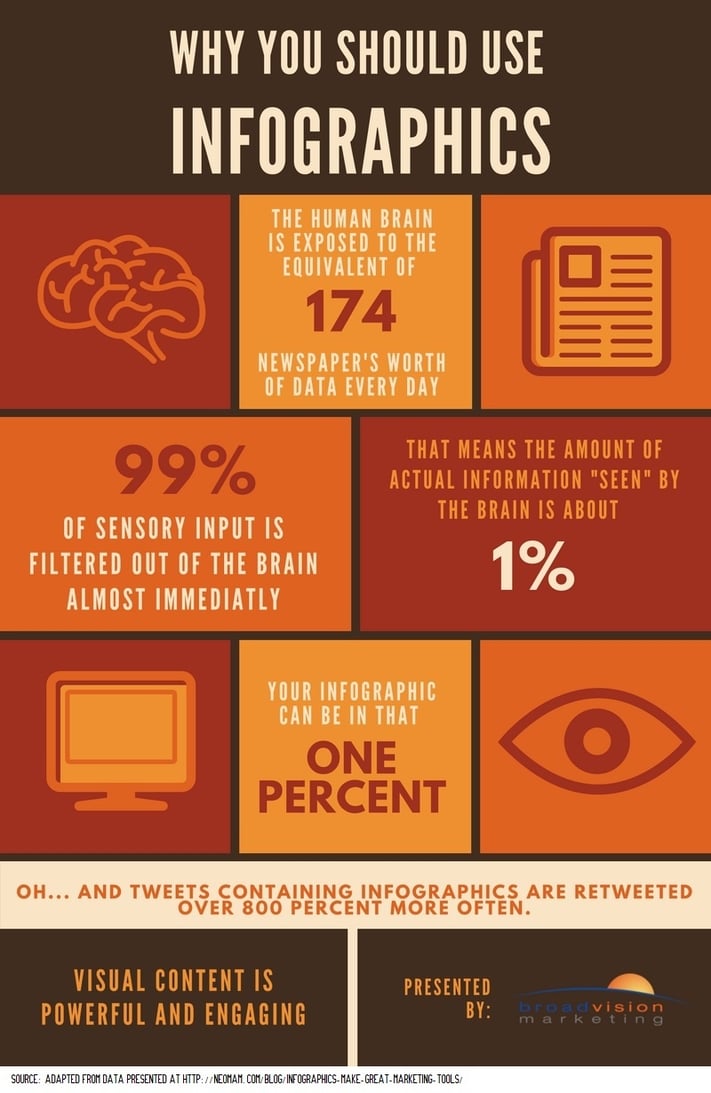
Everyone loves images. Real-world experience shows it and statistics confirm it. Better yet, people love to share visual content. And infographics offer powerful visual content.

We are visual creatures and we love to look at things and we love to watch. This is why video, for example, is increasingly popular in marketing. In fact, this year video content will represent 74% of all internet traffic. And four times as many consumers say they would rather watch a video about a product than to read about it.
We've all noticed the rise of eye-popping, retina-blasting images that increasingly used to illustrate blog posts, articles, and even emails. Graphic content pieces like SlideShare decks have huge appeal and lend themselves to social media sharing, as well.
Which leads us to Infographics.
Are Infographics the King of Visual Content?
Perhaps. While this is debatable, what is not is the power of infographics for engaging visitors and generating traffic and shares. According to a post at Digital Resource,
"Infographics are shared and liked 3x more than an other types of visual content. Businesses that use infographics report 12% higher profit margin than those who don’t."
In addition to boosting traffic and increased shares, infographics have staying power. Viewers are far more likely to download and save infographics, as well as print them out and stick them up on a wall in their cubicle.
Because of the potential of a visually appealing infographic, it is imperative to ensure that the actual data, or "information" part of the graphic, is factual, substantial and relevant. A pretty picture with vague data or "sales-ey" content will not be shared. Nor will it be downloaded.
Simply put, an infographic is a visual representation of data or information. They are particularly useful if you are presenting an incredibly large number of statistics or data to an audience. An infographic can be a superior "data visualization solution" instead of presenting a dense block of text and numbers.
Remember, the term "infographic" is a mash-up, so to speak, of the words "information graphic" Think of it this way: the graphic element is the vehicle for the information that your reader, or viewer, is interested in. The graphics make up the 'sizzle' while the data, or information, is the meat. (or tofu!)
Tips For More Infographic Mileage
The most common and simplest approach for an infographic is to simply publish it somewhere on your website. Perhaps a blog post would be drafted first and then published with the new infographic added as part of the article. However, there are a number of ways you can distribute your great piece of visual content beyond parking it on your website.
Here are some tactics for generating more traffic with your infographic:
1. Showcase it in a blog post
Yeah, we mentioned that already. But it is a great place to start and provides a forum for expanding on the context for the infographic. Statistics also indicate that placing the term 'infographic' in your blog post title inside of brackets increases clicks.
In addition, encouraging your readers to download and share, or embed, your infographic will generate links which boost SEO efforts. By including an embed code the Infographic is automatically linked to your site, along with attribution and other backlinks that occur when your infographic is used.
2. Use it to illustrate an online offer
If you have an offer of some sort - a free eBook or report, for example - or a product you want to promote, an infographic can be designed and created to showcase the benefits and features of your offer. Granted, this is not the type of infographic that will get shared on social media, perhaps, but it will most definitely make your online offer stand out.
3. Create a "sister" visual content piece
Depending on the layout and design elements of your infographic, it can lend itself to being re-formatted into a SlideShare or PowerPoint presentation, or even a short illustrated video.
Another visual content piece that may seem a bit "low-tech", but can be highly effective if used strategically, is a printed version of your infographic. If your budget can manage it, creating larger card stock pieces can be used for direct mailing, handouts for trade shows, or for including in client presentations.
4. Include them in social media posts
Nothing says, "I love you." more than the gift of an eyeball-grabbing infographic on social media. Okay, so that may be an exaggeration, but the time and effort - and care - that you invest in creating and then sharing your infographic matters to your audience.
And statistics show that they respond by sharing. This has exponential possibilities as well as long Internet "shelf life". In other words, your visual content can be seen and shared over and over for months, even years.
Now that is a great content marketing ROI!
Getting Help for Your Visual Content Marketing
Using visual content for your marketing can definitely boost traffic for your website and business. And visual content such as infographics should be an integral part of your content marketing efforts. But achieving your marketing objectives with a content marketing strategy takes time. It won't happen with a few blog posts or some other great content.
People will need to consume your content for a while before they contact you. Yet, without your content compelling them to contact you, your goals may never be met.
The good news is that you don't have to figure out alone. In fact, one of the best investments you can make with your marketing budget is to partner with a solid firm like BroadVision marketing. Click this link to get your free Complimentary Inbound Marketing Session so you can make an informed decision, or call BroadVision Marketing at 707-799-1238.
Maximize Your Visual Content Efforts With Online Tools
Maximize Your Visual Content Efforts With Online Tools
No Comments Yet
Let us know what you think